The candle charts presents an interesting probability.
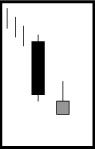
When considering the single candle of the Month of March, the Monthly candle represents a BEARISH PIN BAR, which is Highly bearish

A Pin Bar is a candlestick pattern where the body of the candlestick is very small and has a very long wick. There are two types of Pin Bars a Bullish Pin Bar and a Bearish Pin Bar.
A Bullish Bar is represented by a small body at the top and a long wick below, this indicates that price was sold down by the bears and then immediately bought straight back up by the Bulls. In a perfect world the close is above the open for a bullish pattern and no wick at the top of the body. The opposite of this is true for a bearish pattern.
When considering 2 candles of the monthly chart an Inverted Hammer is in place which has high probability of being a bullish pattern but it has to get confirmation by the third candle.
Description
The Inverted Hammer is comprised of one candle. It is easily identified by the small body with a shadow at least two times greater than the body. Found at the bottom of a downtrend, this shows evidence that the bulls are stepping in, but the selling is still going on. The color of the small body is not important but the white body has more bullish indications than a black body. A positive day is required the following day to confirm this signal.
CriteriaThe Inverted Hammer is comprised of one candle. It is easily identified by the small body with a shadow at least two times greater than the body. Found at the bottom of a downtrend, this shows evidence that the bulls are stepping in, but the selling is still going on. The color of the small body is not important but the white body has more bullish indications than a black body. A positive day is required the following day to confirm this signal.
1. The upper shadow should be at least two times the length of the body.
2. The real body is at the lower end of the trading range. The color of the body is not important, although a white body should have slightly more bullish implications.
3. There should be no lower shadow, or a very small lower shadow.
Signal Enhancements
1. The longer the upper shadow, the higher the potential of a reversal occurring.
2. A gap down from the previous day's close sets up for a stronger reversal move.
3. The day after the inverted hammer signal opens higher.
4. Large volume on the day of the inverted hammer signal increases the chances that a blowoff day has occurred.
Monthly chart with Bearish Pin Bar/Inverted Hammer:


The Low 5604 becomes a very important low which should not be breached. As per monthly levels the bulls would be safe only above 5604.
In weekly charts also such a dilemma occurs. This weeks' candle follow up confirmation is required to decide about the pattern.

In weekly charts also such a dilemma occurs. This weeks' candle follow up confirmation is required to decide about the pattern.

As far as the day charts are concerned, Day is trending down within the Channel and channel breakout would be above 5720 coinciding with the Day Hema which is a signal for upmove to continue. An EOD close above 5720 would be most welcome by the BULLS.


| 5 EMA | 5675 | HIGH | 5693 |
| 5 DMA | 5654 | LOW | 5604 |
| 10 DMA | 5733 | CLOSE | 5683 |
| 200 DMA | 5623 | 50 Hr MA | 5691 |
| HI EMA | 5712 | 20 Hr MA | 5649 |
| LEMA | 5635 |
SYNOPSIS: Protecting 5604 would be the need of hour of the Bulls
Aggressive sell below 5700 with Strict stoploss above 5725- Hourly close
Buy above 5720 with SL 5700 Hourly Close.
Aggressive sell below 5700 with Strict stoploss above 5725- Hourly close
Buy above 5720 with SL 5700 Hourly Close.