This blog is my trading diary. It is an attempt to organise my analysis and thoughts. I follow the charting methods given in JUST NIFTY blog by Ilango sir and so the charts would have striking resemblance to his charts. I am indebted to Ilango sir for having made this blog possible for me.

January 7, 2012

Analysis for Jan 7

Nifty had a volatile day with swift Lows and Highs finally to close near yesterday's close at 4754. A Spinning top candle is formed in Day Charts.


Candlesticks with a long upper shadow, long lower shadow and small real body are called spinning tops. Spinning tops represent indecision. The small real body (whether hollow or filled) shows little movement from open to close, and the shadows indicate that both bulls and bears were active during the session. Even though the session opened and closed with little change, prices moved significantly higher and lower in the meantime. Neither buyers nor sellers could gain the upper hand and the result was a standoff. After a long advance or long white candlestick, a spinning top indicates weakness among the bulls and a potential change or interruption in trend. After a long decline or long black candlestick, a spinning top indicates weakness among the bears and a potential change or interruption in trend.

Source : Stock charts.com
Jan 5th Day made a DOJI - which is an indecisive candle. Jan 6th Candle is spinning top again depicting indecision.
So a continous tug of war is happening between the bulls and the bears.
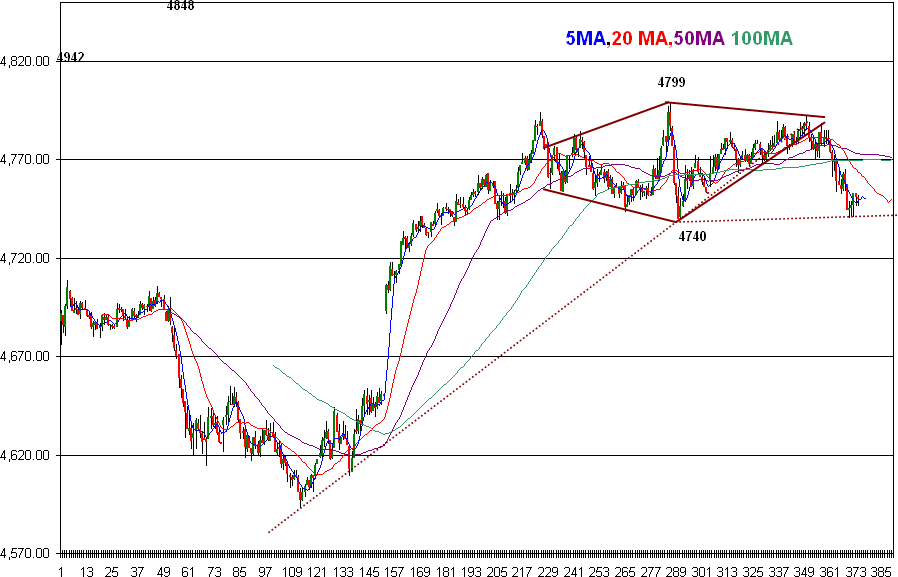
The Falling wedge formed in Weekly Charts is intact.

January 6, 2012

Analysis for Jan 6

Intraday Update 2.45:PM:
The present High at 4794 just touched the upeer line of the Falling wedge in Day Chart.


The Longs are terminated at 10.AM as the close was 4715.

Currently there are few interesting clusters between 4680-4720. Today being the week end , a Close below 4680 would warrant more downsides and only a close above 4720-30 would warrant more upsides.

Supports:
Week Pivot -4680
Day Lema -4690
100 Hr MA - 4690
The 50 Hr MA is at 4701. So a fast rise set up in Hourly charts with 50Hr MA and 100 Hr MA.

January 5, 2012

ANALYSIS FOR JAN 5

Intraday Update: 3.00PM:
Reinitiated 50% longs at 4742NF with 4715 Day EMA as SL.

Diamond pattern update:


Close below 4715 yestersday's Day 5EMA or close below the today's developing day Ema at 4725 will reverse the ST trend to downwards as it will have breached the Month Lema also.

January 4, 2012

Analysis for Jan 4

INTRADAY UPDATE: - 12.00NOON:

NS has reached a low of 4740 - corresponding to 20 DMA and Month Lema. So weakness would set in if this level breaks. So the SL ia trailed to an Hourly CLose below 4740 - 20 DMA.
If a fast fall of 20 MA with 100 MA occurs then the SL would be triggerred - and downward targets upto Day Lema - 4645.
If crossover occurs then the upmove would continue towards 200 Hr MA and above.

 20 Hr MA  50 Hr MA  100Hr MA  200Hr MA 
                 4,674        4,705        4,688          4,776
                 4,678        4,705        4,688          4,776
                 4,682        4,705        4,689          4,776
                 4,687        4,705        4,689          4,776


ANALYSIS FOR JAN 4:
Nifty crossed all resistances to form a high of 4773 -corresponding to 200 Hr MA and 26 DEMA and closed above the Day Pivot, Day Hema, Week Lema and Month Lema.

Unless there is a close below 4725 -Day Hema the uptrend is likely to continue. Holding 4725 - NS is likely to reach upto the 4801-4850 - week 5SMA.

January 3, 2012

Analysis for JAN 3

Intraday Update:
The partbooked Longs was reenteres at the Hourly close above 4730. The SL for this Longs is revised to current Day High EMA @ 4725.

Intraday Update 9.20 AM:
Partbooked at 4703NF - as Day Hema is 4700 NS for Today and for the remaining the SL is shifted to Day Lema of 4630
There are a series of resistances at 4700-4730 NS ranges By way of
Day Hema - 4700, Day 13 EMA-4705, Week 5EMA - 4710,  Month LEMA - 4730.
Longs can be added on a close above 4730NS

ANALYSIS for JAN 3:
Nifty Opened on a Positive note and then made a low of 4588 and regained back to close near the open value but above the Day Lema (indicating a pause in downtrend)- Forming a Dragonfly DOJI (CLICK HERE).  A Doji usually represents indecisiveness - but the dragonfly Doji is considered to be a bullish reversal candle.

The Bearish Bat pattern (Click Here) is valid till the PRZ is reached. If the Low of 4531 breaks then the Bearish Bat pattern of Hour TF would be invalidated.

January 2, 2012

ANALYSIS FOR 2 JAN 2012

A 50%  Buy is initiated at 4610NF with Positional SL at 4530 NS. More Longs can be added at 88.6% retr at 4560-65 NS levels.

Bearish bat PATTERN has formed in Nifty Hour Charts. Similar pattern has formed in Bank Nifty Charts also.

January 1, 2012